


Form insights
The Insights tab shows how a form is performing: how many people reached it, how many of them submitted, and where they came from. It is available on all plans, and every form has its own.
Insights are about the form itself rather than about any one submission. For the submissions themselves, use the Submissions tab.
Open a form's insights
- On the Upload Forms page, open your form.
- Click Insights in the row of tabs at the top.
A form only starts collecting insights once it is published. A Draft form records nothing, because nobody can reach it yet.
Choose a date range
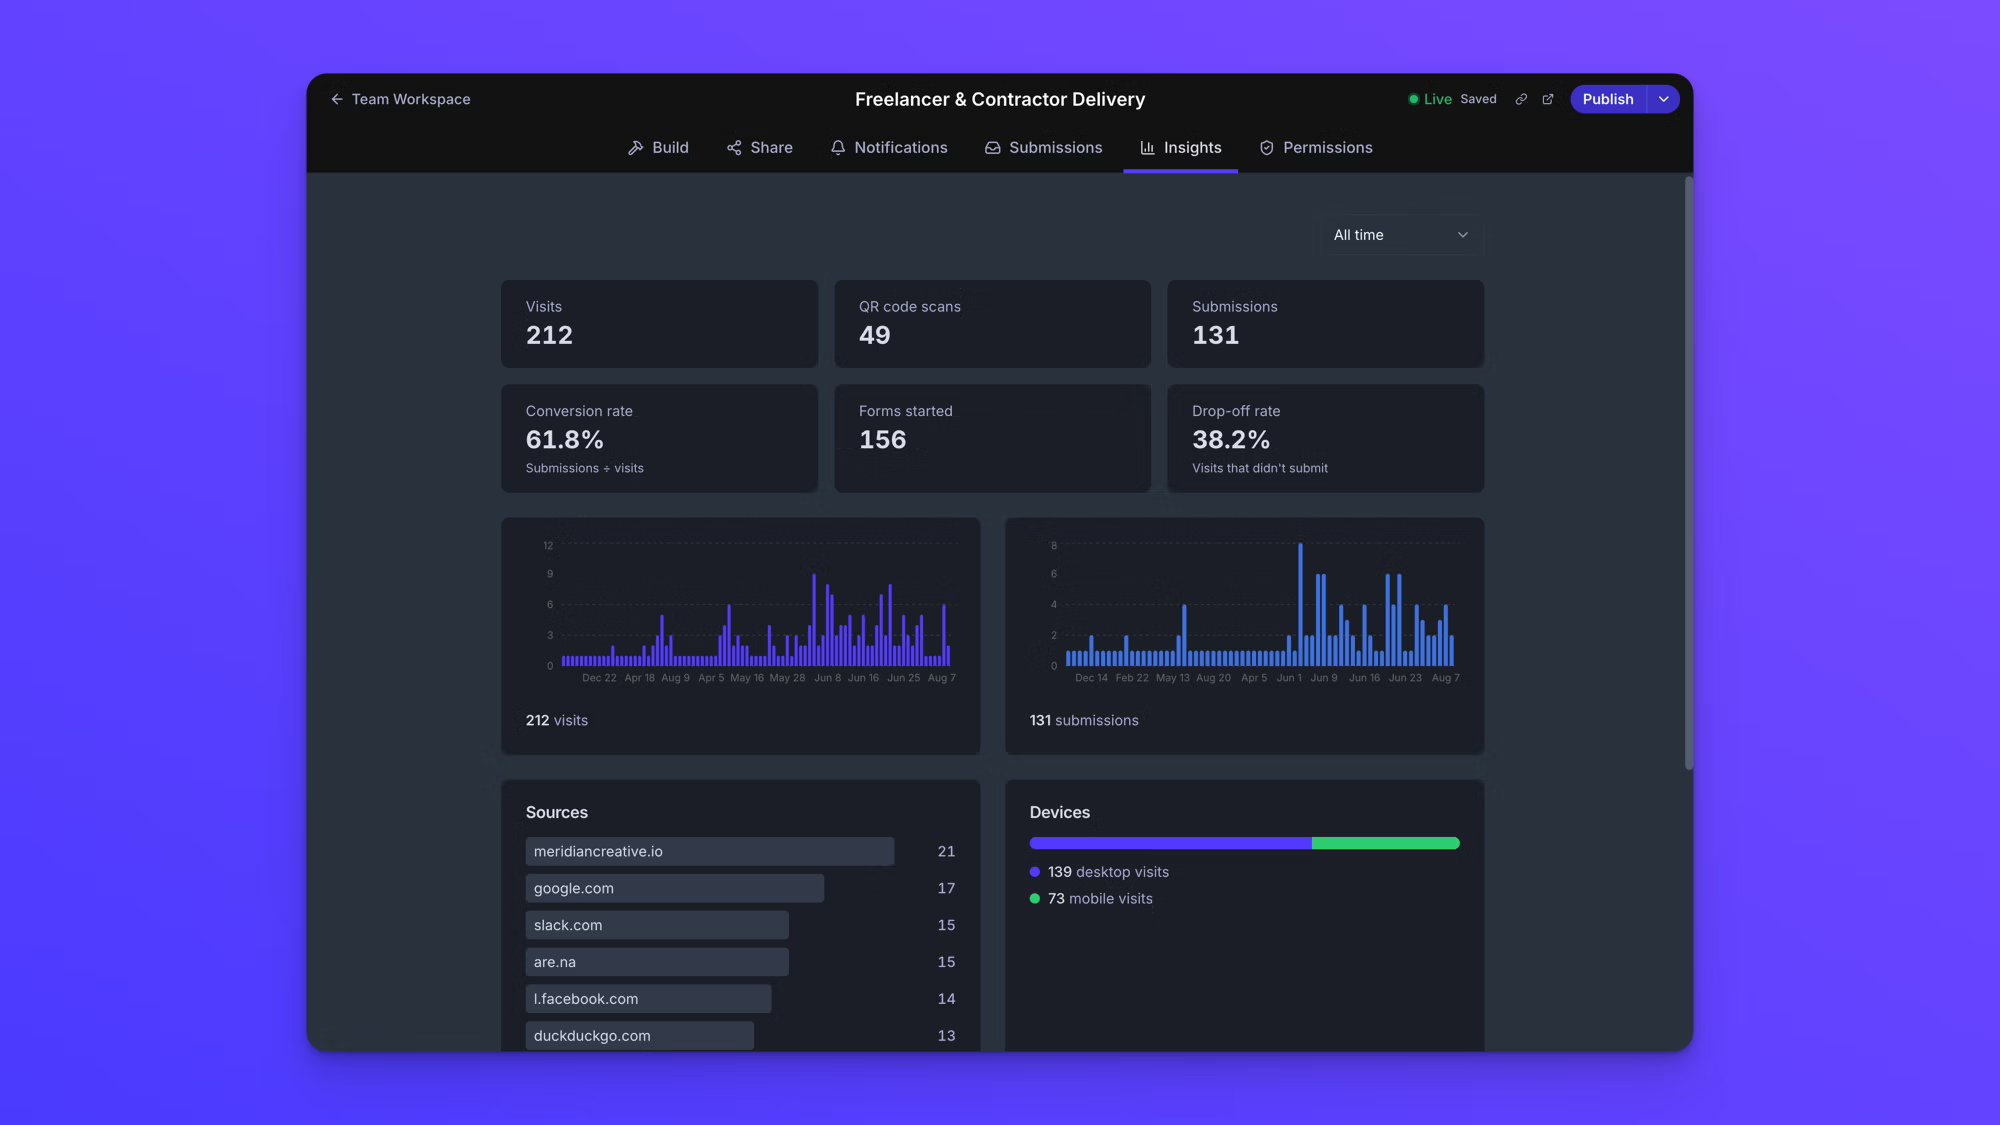
Every number and chart on the tab reflects the date range selected in the dropdown at the top right. It defaults to "All time".
The options are All time, Last 7 days, Last 30 days, Last 90 days, and Custom range. Custom range lets you set your own start and end dates. Changing the range updates the whole tab at once, including the breakdown panels at the bottom.
What each number counts
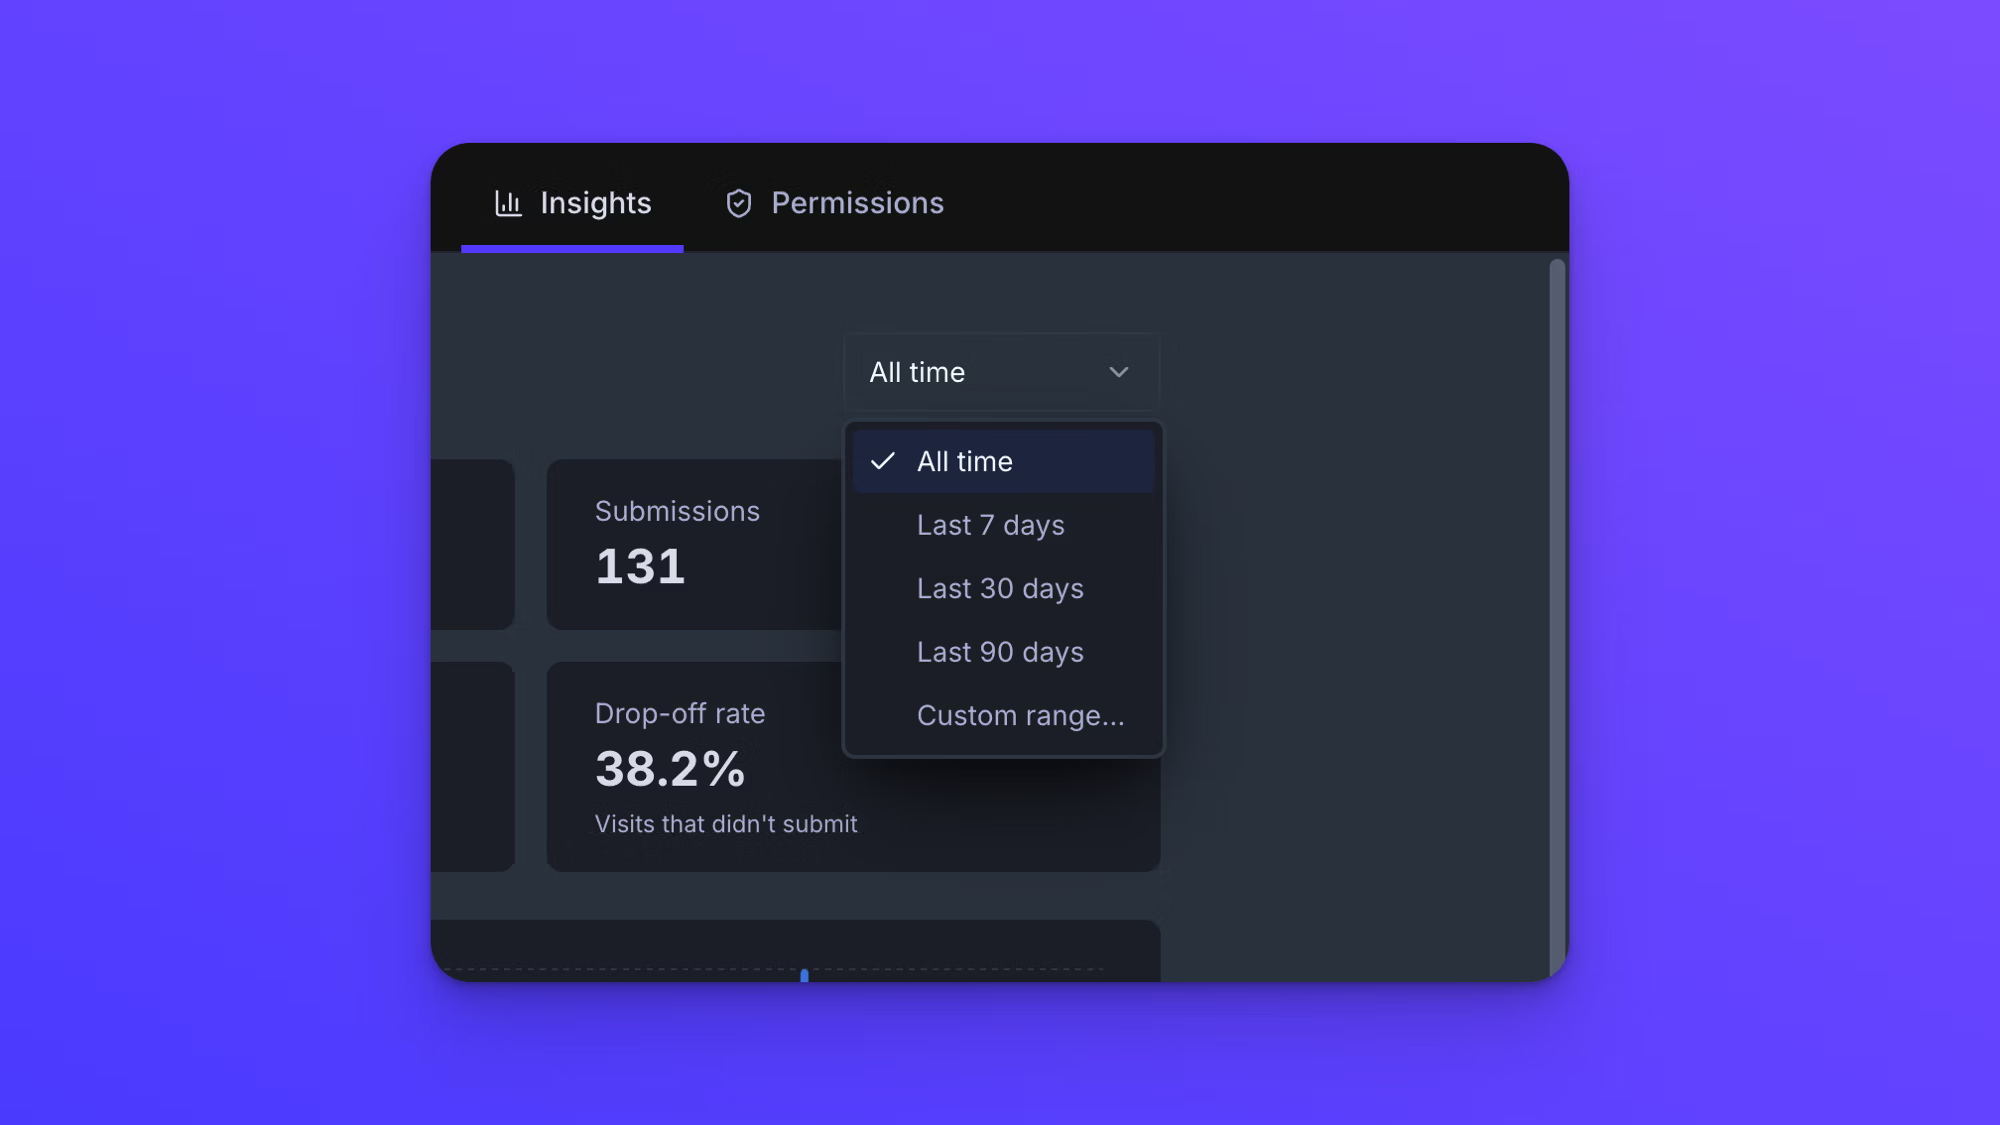
A row of cards sits across the top of the tab.
- Visits counts every time the form was opened. It is not counted per person, so one visitor who reloads the page three times counts as three visits.
- QR code scans counts the visits that arrived by scanning the form's QR code. A scan is also counted in Visits, so the two never double up: one scan is one visit and one scan. Every form has a QR code, on every plan.
- Submissions counts completed submissions. This matches the count on the Submissions tab for the same date range.
- Conversion rate is submissions divided by visits, shown as a percentage. The card states the formula under the number.
- Forms started counts visitors who began filling the form in. A visit is counted here the first time that person fills in a field or adds a file, once per visit.
- Drop-off rate is the share of visits that did not end in a submission. The card describes it as "Visits that didn't submit".
The gap between Visits and Submissions is usually the most useful thing on this tab. A form with few visits and a high conversion rate has a sharing problem. A form with many visits and a low conversion rate has a form problem. Forms started sits between the two and tells you which: people who started and did not finish were lost inside the form, and people who never started were lost before it.
Visits and submissions over time
Two bar charts sit below the cards. The left chart plots visits over time and the right plots submissions, each labeled with its total for the selected date range.
Reading them side by side is what tells you whether a change you made had an effect. A spike in visits without a matching spike in submissions is the pattern worth looking into.
Where your visits came from
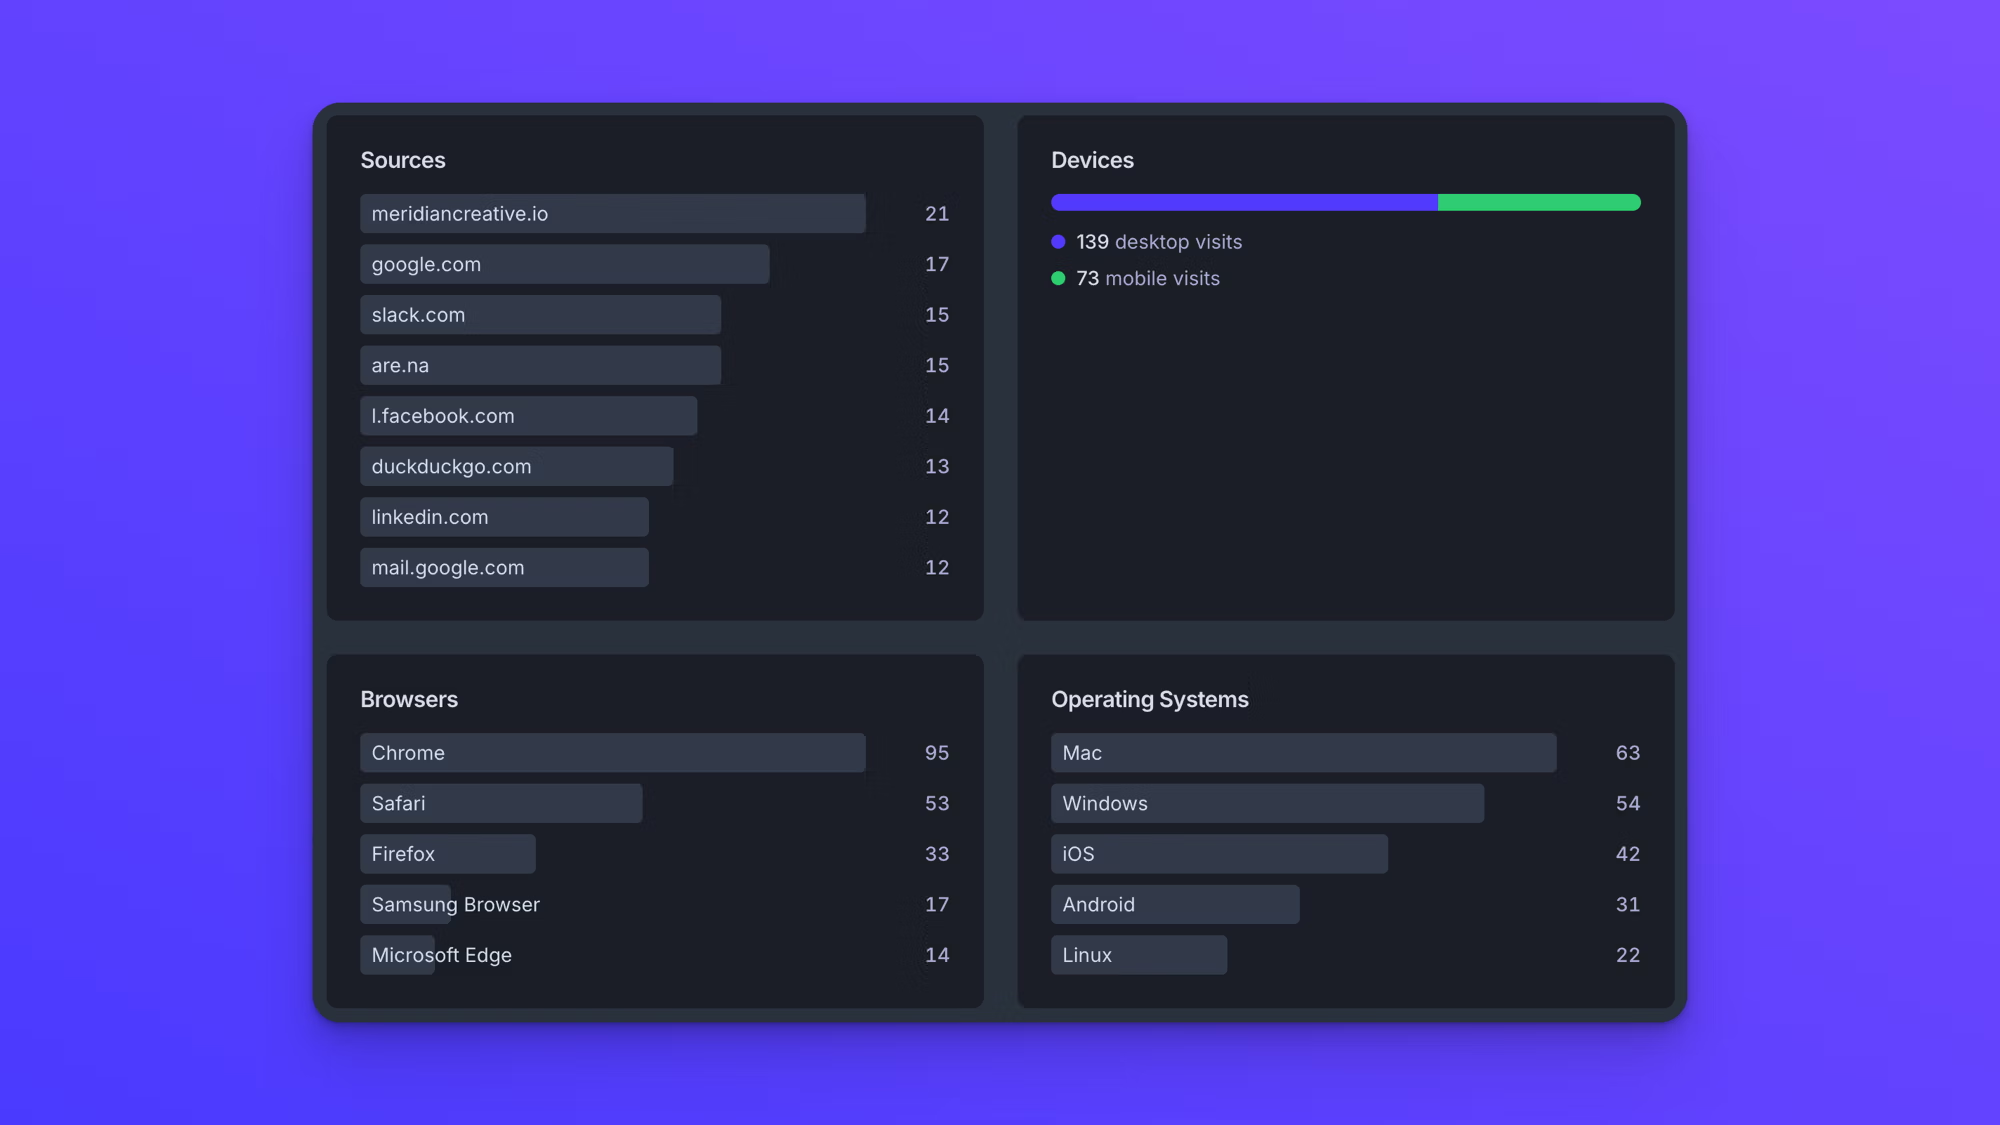
The Sources panel lists the sites people arrived from, with a count beside each one, showing the top eight from most to fewest.
Only visits that arrived from a link on another website appear here. A visit with no referring site is left out of this panel rather than grouped as direct traffic, and that covers QR code scans, most email clients, and anyone who typed or pasted the link. So the counts in Sources will add up to less than Visits, often much less, and that is expected rather than a gap in the data.
An embedded form reports the page it is embedded on, so the site hosting your form appears as the source.
Devices, browsers, and operating systems
Three panels at the bottom break your visits down by the equipment people used.
- Devices splits visits between desktop and mobile, with a count for each.
- Browsers lists the top six browsers people used, with a count for each.
- Operating Systems lists the top six operating systems people used, with a count for each.
This matters most when someone reports a problem uploading. Knowing that a meaningful share of your uploaders are on mobile changes how you build and test a form.
Behavior notes
- Insights are per form. Each form has its own Insights tab, and there is no combined view for your whole account.
- Every number on the tab, including the breakdown panels, follows the selected date range.
- Submissions here counts the same submissions listed on the Submissions tab, so the two agree for the same date range.
- Embedded forms report insights exactly as a shared link does, since an embedded form is the same form. Previewing your own form in the builder is not counted.
- A visit is recorded when the form itself opens. Someone stopped by a password prompt, a schedule, or a submission limit does not reach the form, so those are not counted as visits.
- Insights measure people reaching and using the form. They say nothing about what was uploaded or how large it was.
- Who can open this tab is set per form and per person, separately from who can see submissions. See Set form permissions.